Bitcoin’s key indicator is flashing again: Could a major rally be on the way?
A key Bitcoin indicator has flashed for the fifth time, suggesting an upward surge in the coming days.

Bitcoin has finally managed to bounce back from its potential market low. Despite high buying pressure, some indicators have turned bearish.
After a week of price increases, Bitcoin [BTC] has once again seen a decline in the past 24 hours. However, this trend may change in the coming days as BTC follows its historical trend. If history repeats itself, investors may soon witness a major price movement.
Key Bitcoin Indicator Flashes
AMBCrypto previously reported that Bitcoin managed to surpass $64,000 a few days ago, but this move did not hold. The king coin saw a price correction of nearly 2% in the last 24 hours, bringing it down to $63,117.53.
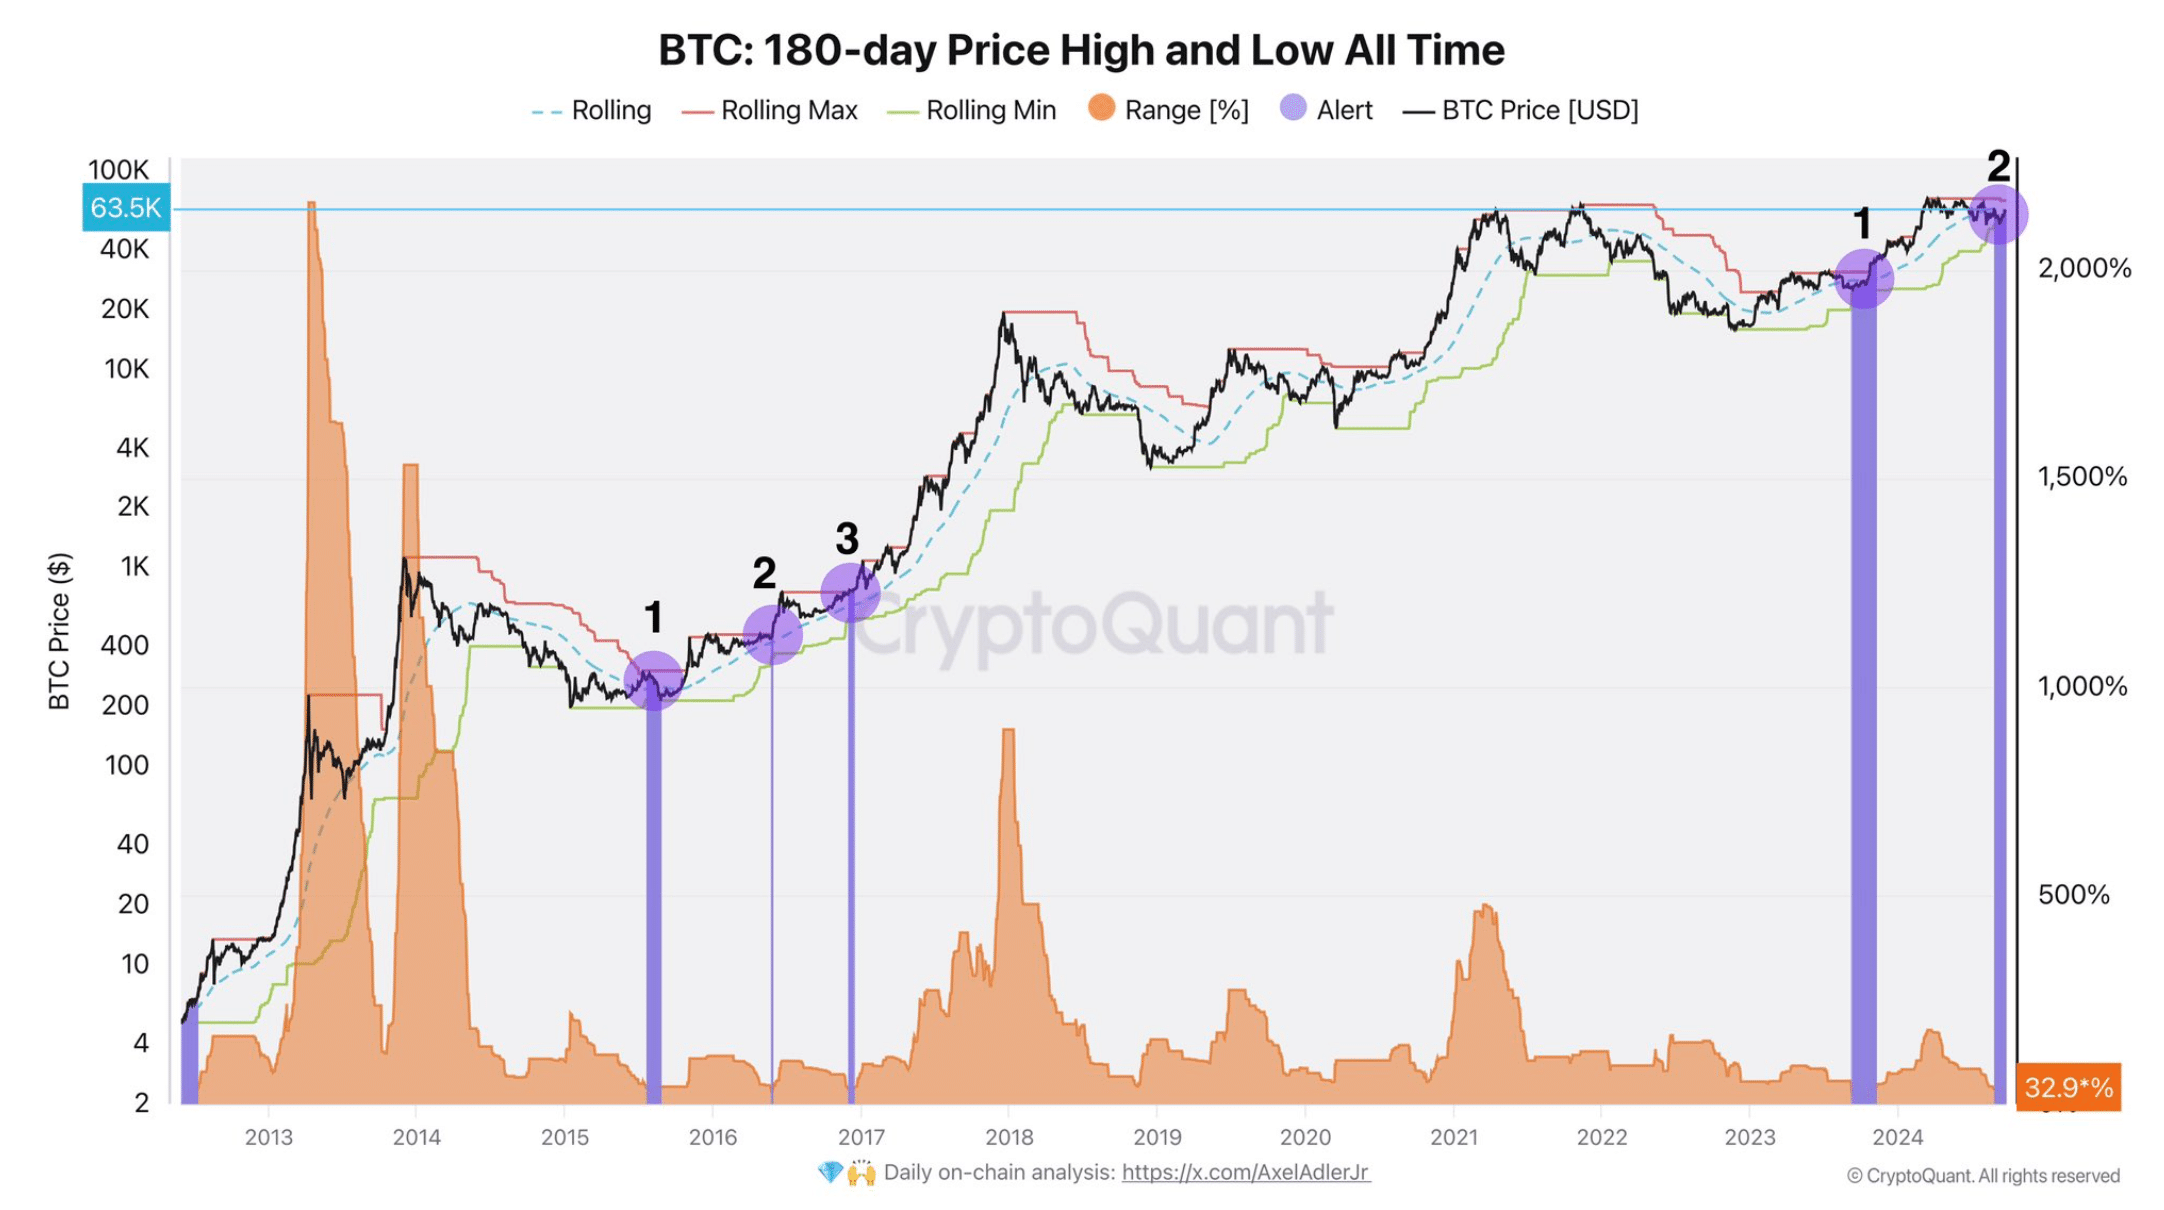
As this occurred, Axel, a popular cryptocurrency analyst, tweeted an interesting development. According to the tweet, volatility has continued to decrease over the past six months, and a warning has appeared on the chart.
Notably, this warning has appeared for the fifth time in Bitcoin’s history.
Specifically, such warnings emerged in the years 2015, 2016, 2017, and 2023, and have reappeared in 2024. Historically, whenever this warning has appeared, Bitcoin’s price has recorded a significant upward movement.
Therefore, if history repeats itself, investors may expect Bitcoin to begin a new upward trend in the coming days.
Source: X
Is BTC Ready for a Price Pump?
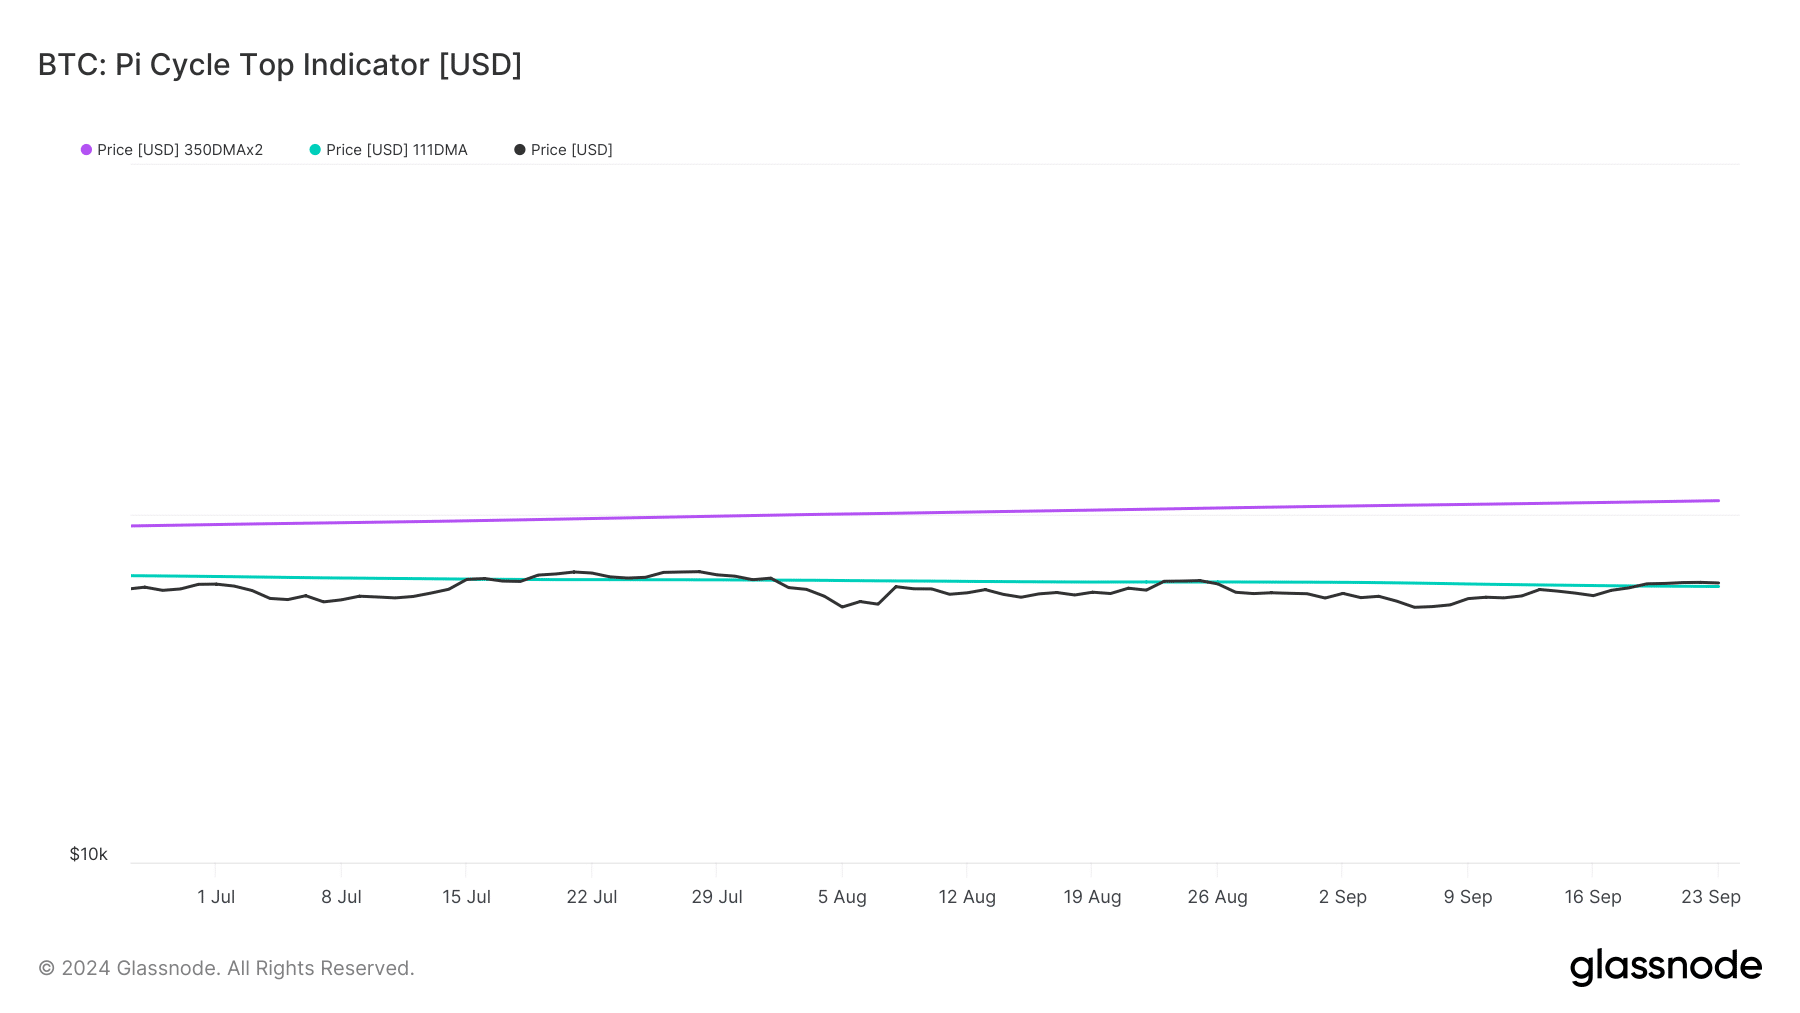
As history suggests a new upward rally, AMBCrypto examined Bitcoin’s on-chain metrics to determine if they also indicate a price increase. Our analysis of Glassnode data revealed that Bitcoin’s price has bounced above $61,800 from its potential market low.
If we believe the Pi Cycle indicator, a future bullish rally could drive the coin toward its potential market high of $109,000 in the coming weeks or months.
Source: Glassnode
In addition, AMBCrypto previously reported that the buying pressure on the coin has been high, indicating a potential price increase. However, not everything is in favor of the king coin.
Our analysis of CryptoQuant data revealed that Bitcoin’s aSORP has turned red. This clearly means that more investors are selling for profit. In the midst of a bull market, this could indicate a market top.
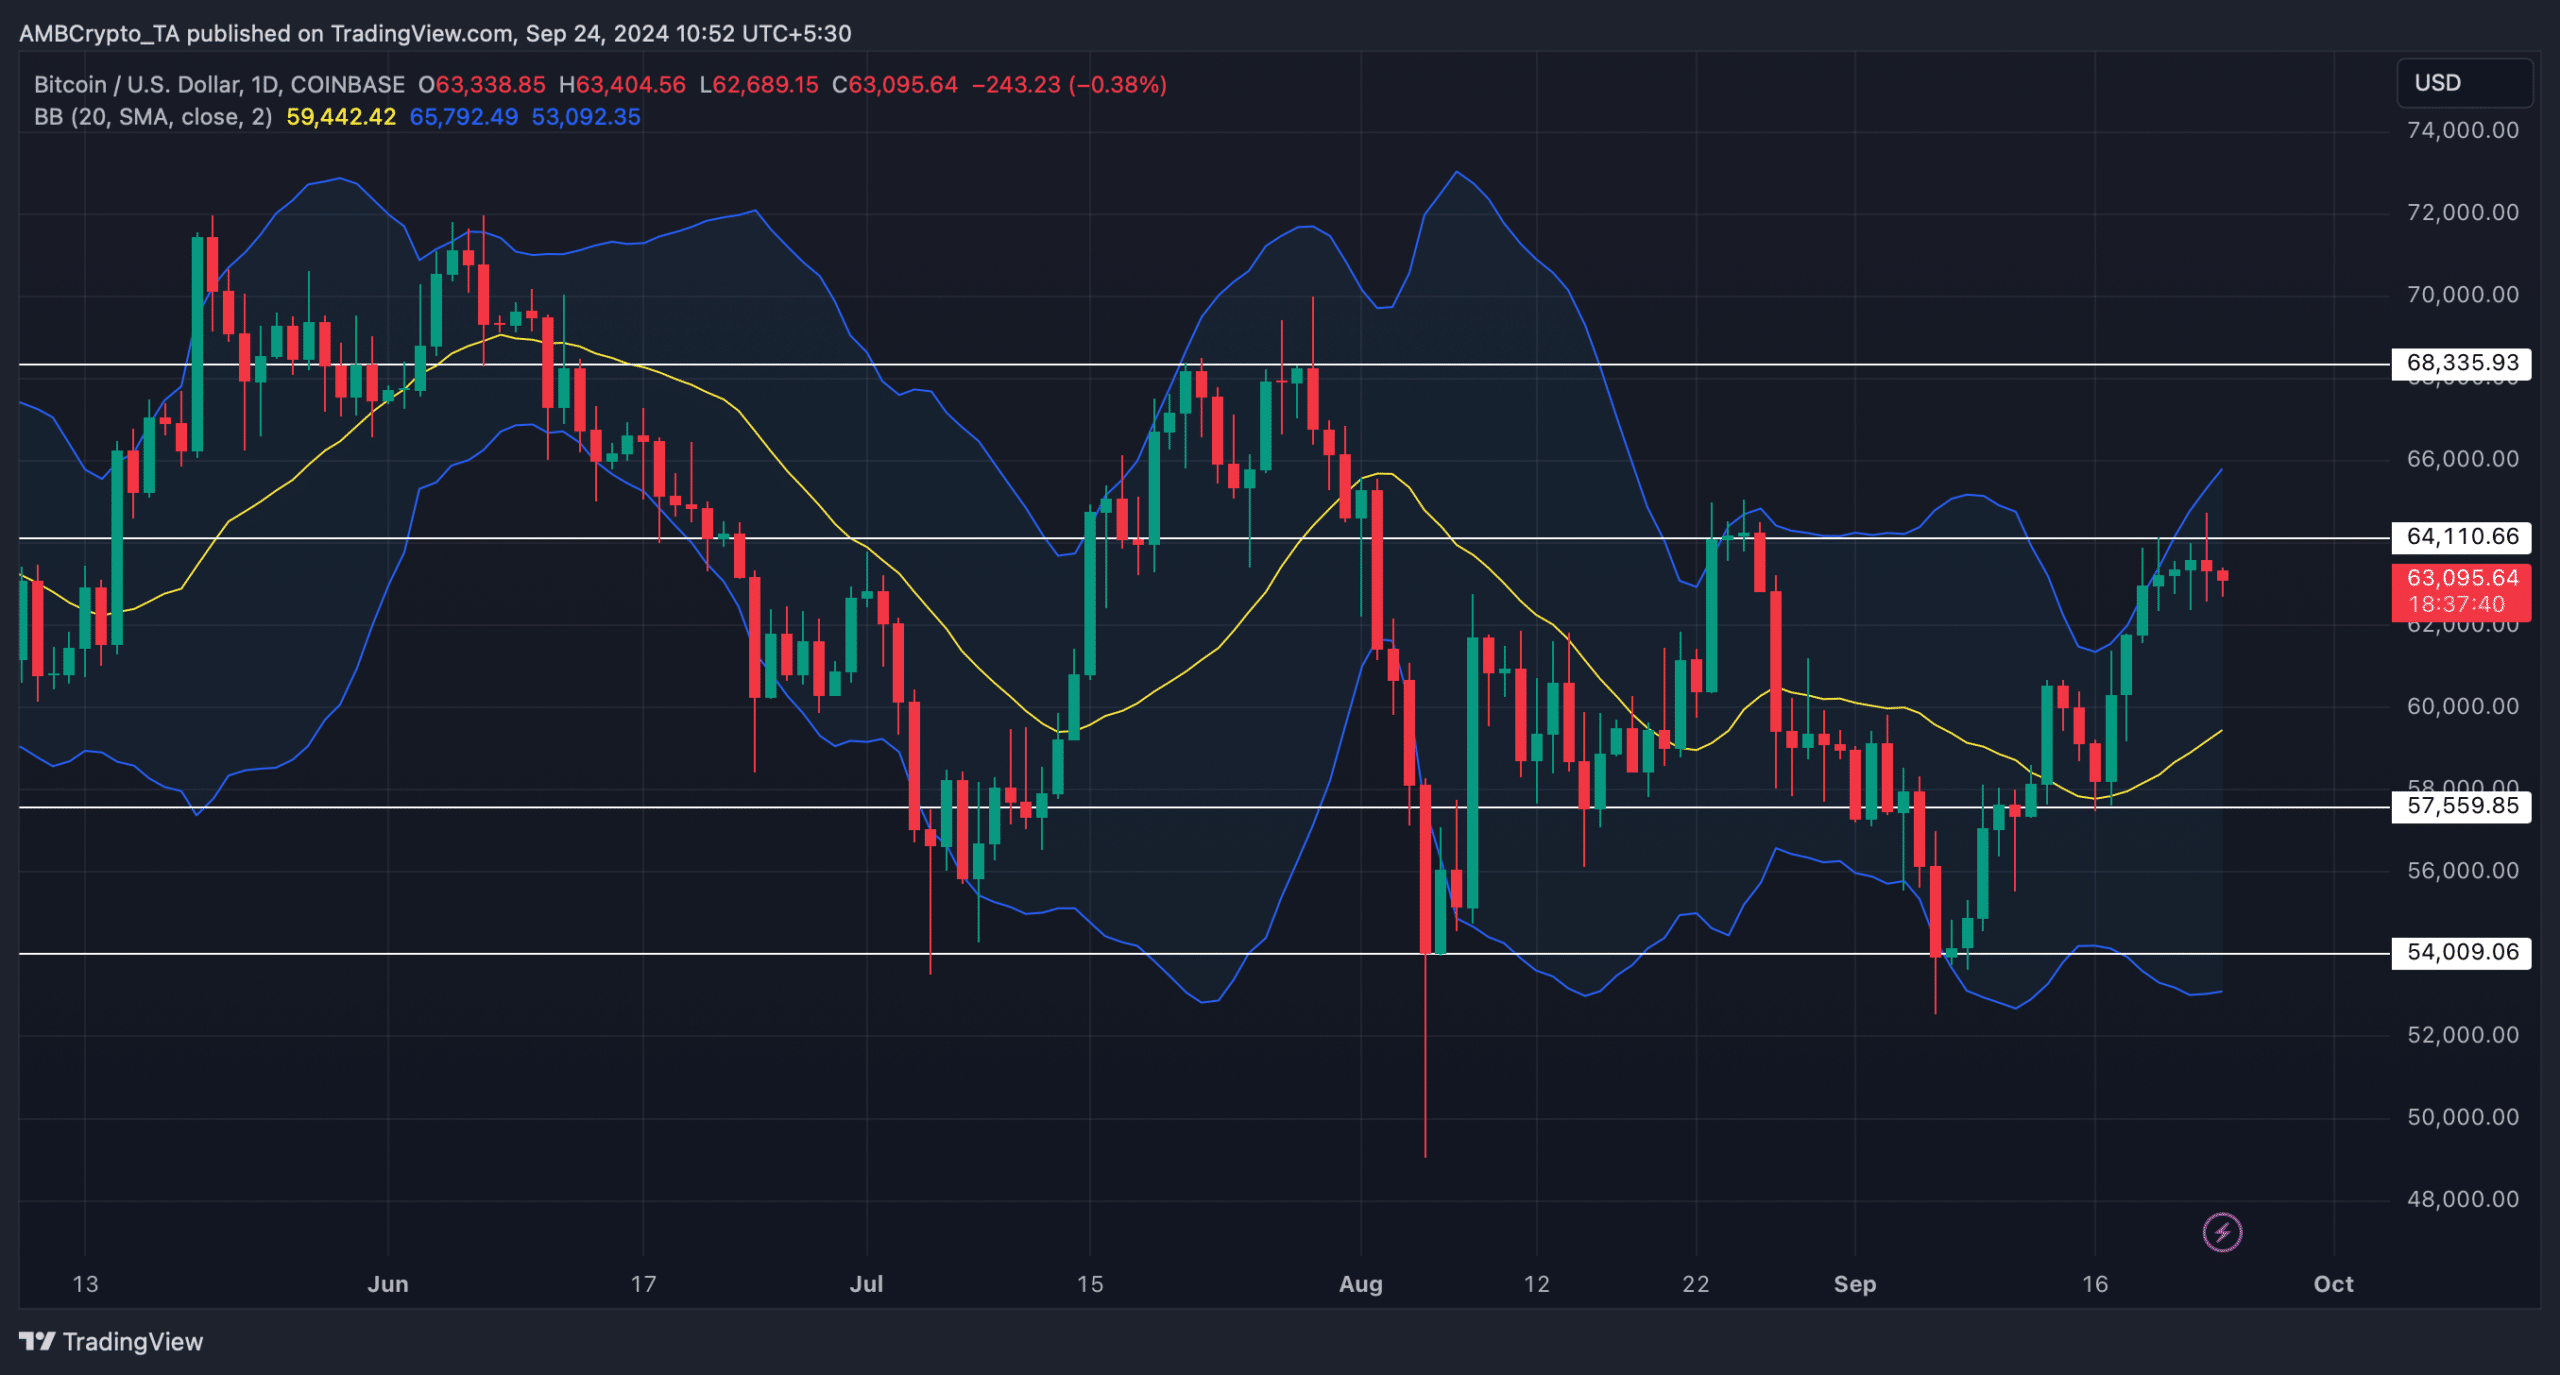
We then looked at Bitcoin’s daily chart to better understand the potential for an upward move. According to our analysis, Bitcoin was rejected at its resistance level of $64.1K.
Furthermore, the coin’s price has reached the upper limit of the Bollinger Bands, suggesting a price correction is on the horizon.
Source: TradingView
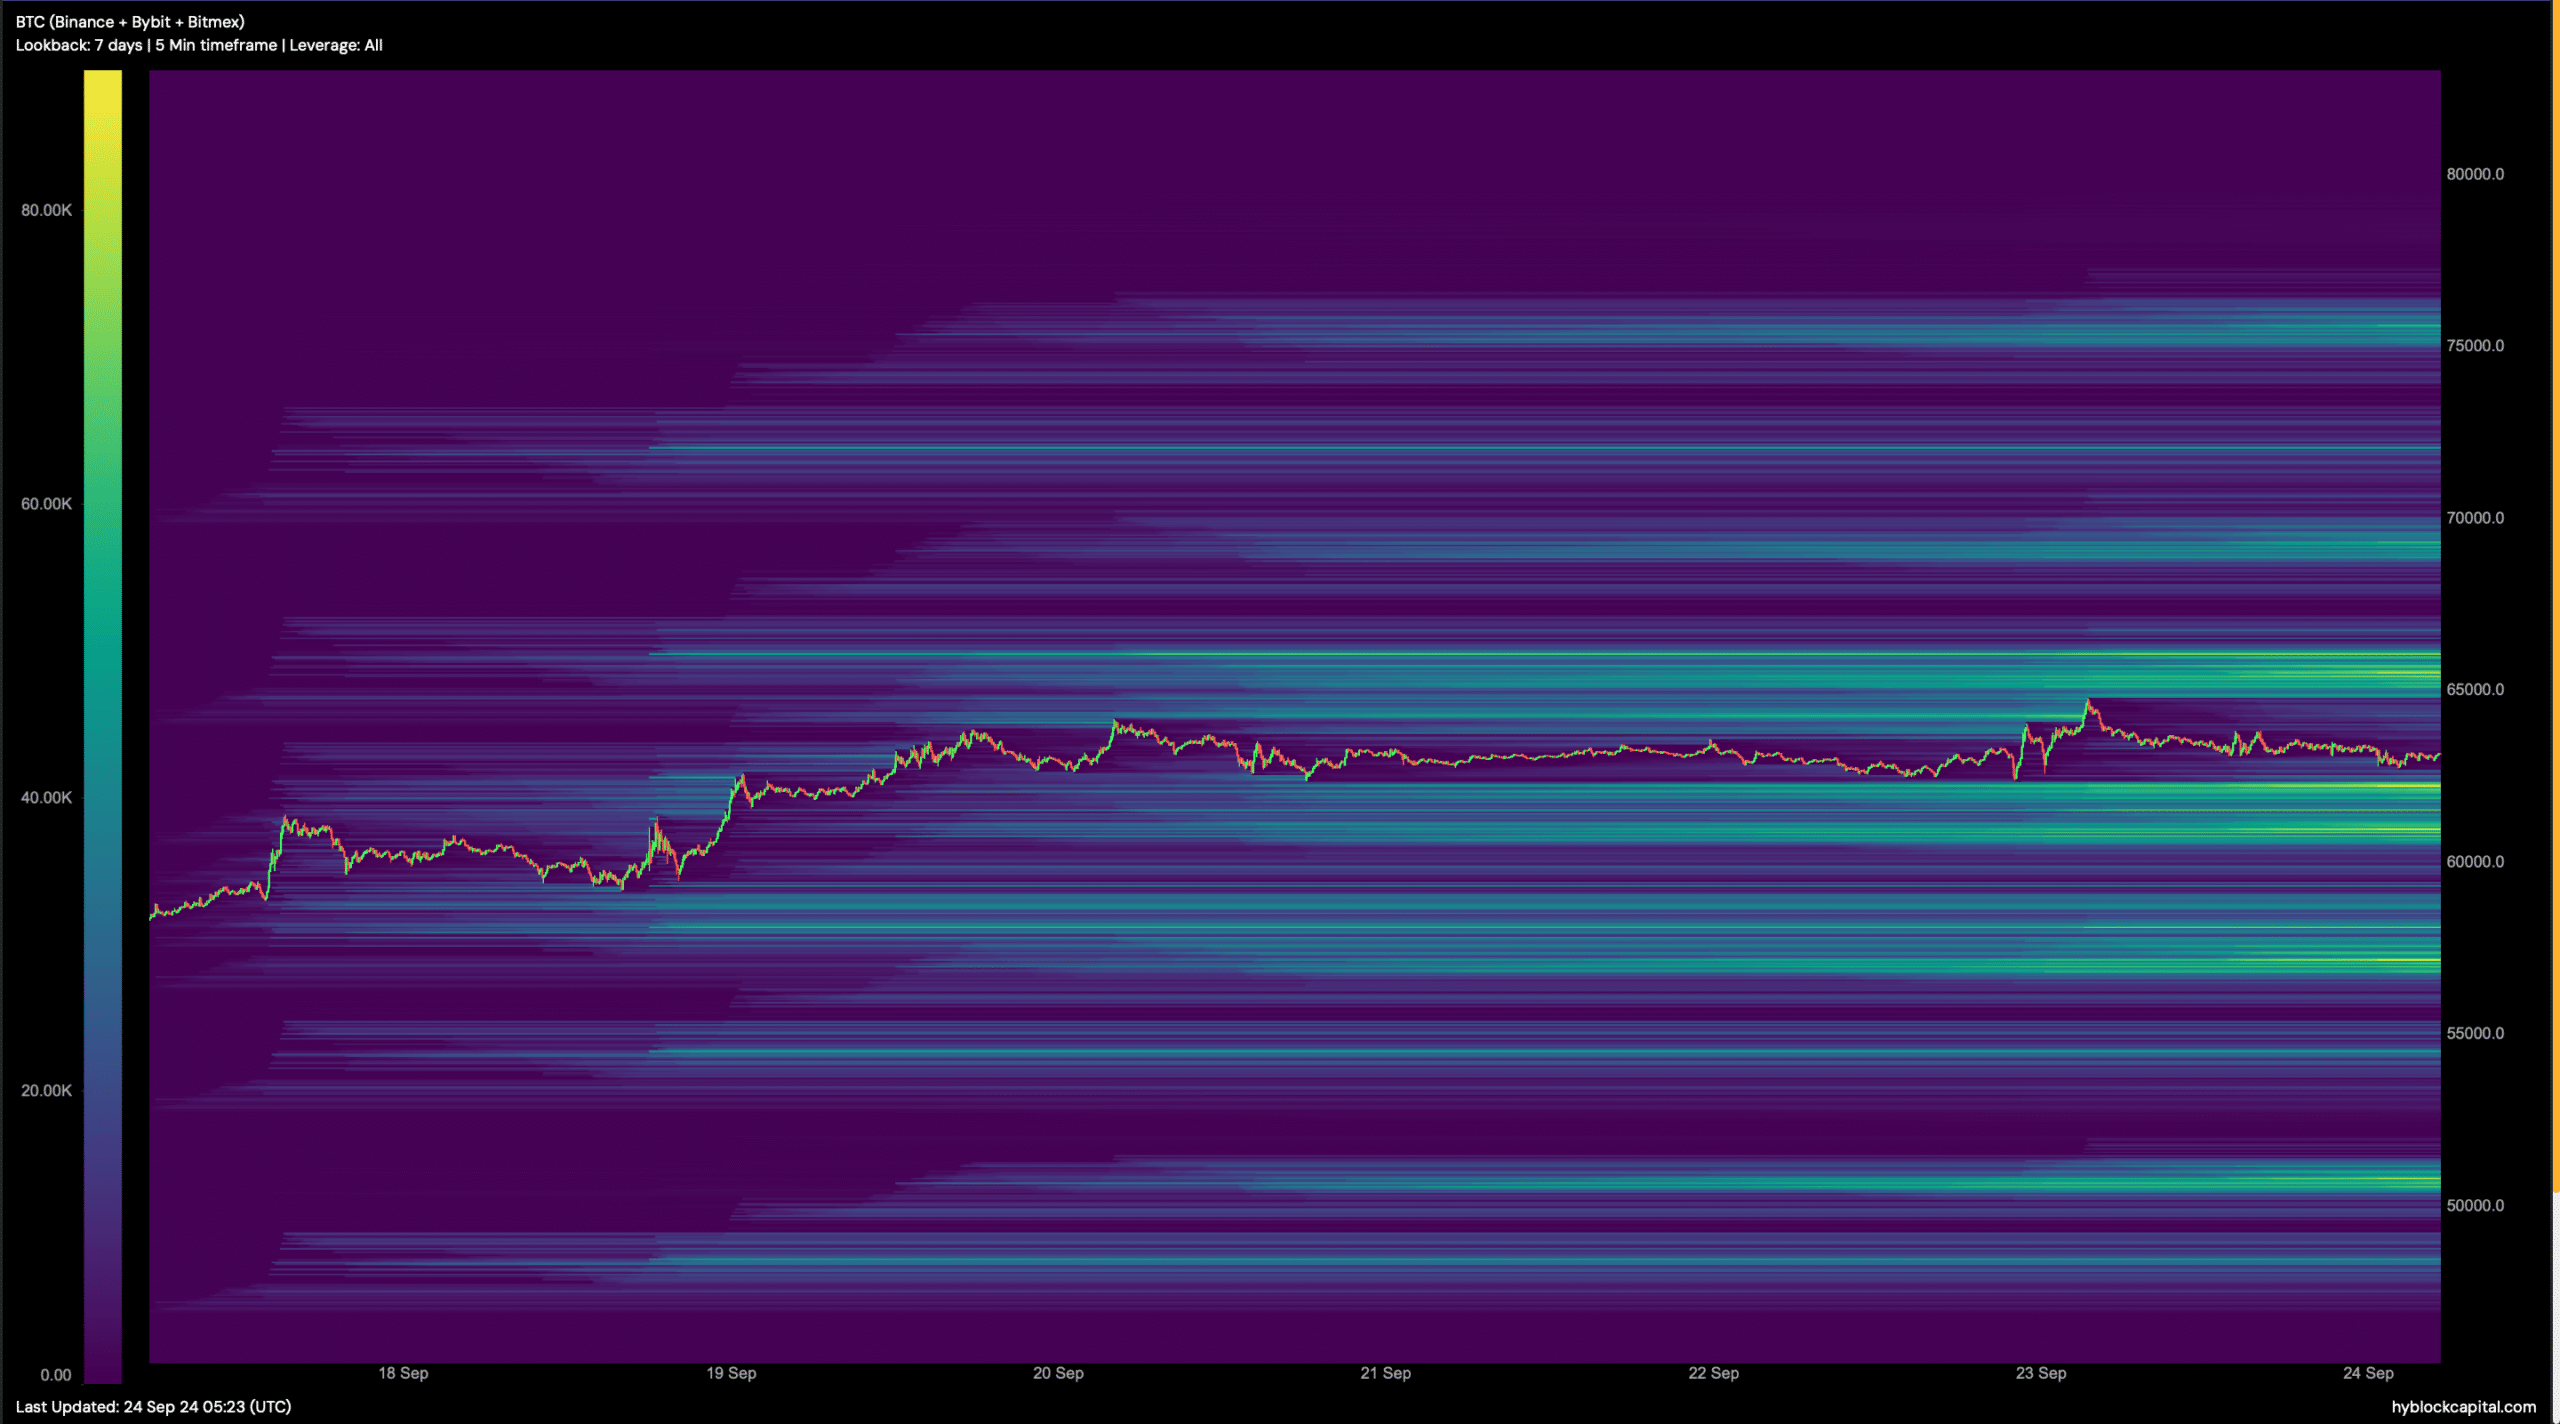
If a price correction occurs, Bitcoin may drop back to $62,000. However, in the case of a bull rally, it is crucial for Bitcoin to break above the $64,000 to $65,000 range, as liquidation in that area would increase significantly.
Typically, rising liquidation leads to a short-term price correction.
Source: Hyblock Capital


