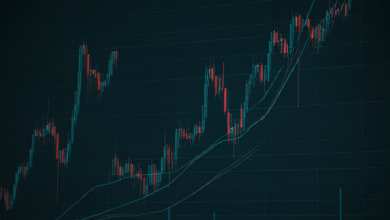
Technical Analysis
Technical analysis is a method for evaluating and predicting price movements in financial markets. This analysis is based on historical price data and trading volume, and traders use it to identify patterns, trends, and entry and exit points in trades.

Fundamentals of Technical Analysis
Technical analysts believe that prices in the market reflect all available information, and price movements occur due to changes in supply and demand. Therefore, they look for patterns that may repeat in the future.
Types of Charts
- Line Chart: The simplest type of chart that shows only the closing price of an asset over time. This type of chart is easy to understand but provides less information.
- Bar Chart: This chart shows more details, including opening, closing, highest, and lowest prices during a specific period. This information helps analysts better understand price fluctuations.
- Candlestick Chart: This chart depicts price movements more accurately and includes information similar to the bar chart. Candlestick patterns can help identify potential changes in price trends.
Tools of Technical Analysis
- Indicators: These tools are used to analyze price movements and identify trends, entry, and exit points. Some popular indicators include:
- Moving Average: Helps identify trends and generate buy and sell signals.
- Relative Strength Index (RSI): Used to identify overbought and oversold conditions.
- MACD (Moving Average Convergence Divergence): Helps identify changes in price trends.
- Chart Patterns: Analysts look for specific patterns in charts that may indicate a change in price trends. Some well-known patterns include:
- Head and Shoulders Pattern: Indicates a trend change from bullish to bearish.
- Triangle Pattern: Can indicate a continuation or change in trend.
Market Psychology
Technical analysis not only focuses on price movements but also considers the collective behavior of traders. Understanding how trader emotions and psychology impact prices can help identify better entry and exit points.
Strengths and Weaknesses of Technical Analysis
- Strengths:
- Pattern Recognition: Technical analysis can help identify price trends and guide traders in their trading decisions.
- Applicability Across Markets: This type of analysis can be used in various markets, including stock, forex, and cryptocurrency markets.
- Weaknesses:
- Neglect of Fundamental Factors: Technical analysis does not consider fundamental information and may have less accuracy under certain market conditions.
- Probability of Predictions: There are no guarantees for prediction accuracy, and prices can move unpredictably.
In Summary
Technical analysis is a powerful tool for traders that can help them identify entry and exit points. By using charts, indicators, and price patterns, traders can make better decisions and reduce existing risks. At the same time, paying attention to market psychology and combining technical analysis with other methods can enhance prediction accuracy.


