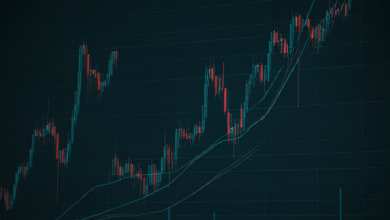
Technical and Fundamental Analysis: The Two Essential Pillars of Trading
Technical analysis and fundamental analysis are the two primary methods for examining and predicting price movements in financial markets. These two approaches complement each other, providing different insights into the value of assets and potential price changes. In this article, we will introduce both analysis methods and explain how to use them in trading.

1. Technical Analysis
Technical analysis focuses on predicting future trends based on past market data, especially price and trading volume. In this analysis, traders use charts and various indicators to analyze price changes and identify recurring patterns. Key tools and concepts in technical analysis include:
- Price Chart: Charts that show the price changes of assets over different time frames. Types include line charts, candlestick charts, and bar charts.
- Technical Indicators: Mathematical tools that help analyze price trends. Notable indicators include:
- Moving Average: Shows the average price over a specific time period, helping to identify trends.
- Relative Strength Index (RSI): A tool for measuring overbought or oversold conditions in the market.
- MACD: An indicator that shows the trend and strength of price movement.
- Chart Patterns: Recurring patterns in price charts that help identify potential future trends. Examples include head and shoulders, triangles, and flags.
Technical analysis allows traders to make decisions based solely on past price behavior, regardless of an asset’s fundamental status.
2. Fundamental Analysis
Fundamental analysis examines economic, financial, and other variables related to an asset to determine its intrinsic value. This type of analysis focuses more on macroeconomic data, company performance, and other fundamental factors. Key factors in fundamental analysis include:
- Economic Conditions: Factors such as interest rates, economic growth, inflation, and fiscal policies that can influence an asset’s value.
- Corporate Performance: In the stock market, fundamental analysis involves examining company financial statements, revenues, profitability, debts, and other financial factors. Traders can estimate the true value of a company’s stock by evaluating this data.
- Global News and Events: Political, economic, and industry news can significantly impact asset prices. For instance, changes in trade policies or the passing of new laws can cause price volatility.
Fundamental analysis helps investors determine the true value of an asset and make trading decisions based on that evaluation. This type of analysis is primarily used for long-term investments.
3. Differences and Advantages of Each Method
Both technical and fundamental analysis have their applications, and traders often use a combination of the two methods for their trading decisions. Here are the differences and advantages of each:
- Technical Analysis is more beneficial for short-term and medium-term trading as it focuses on daily and momentary market changes. In contrast, fundamental analysis is better suited for long-term investments, emphasizing the intrinsic value of assets.
- Technical Analysis allows traders to quickly enter and exit trades and profit from price fluctuations, while fundamental analysis emphasizes a deeper understanding of the market and the underlying reasons for price changes.
Conclusion
Technical and fundamental analyses are two distinct approaches to examining and predicting asset prices in financial markets. While technical analysis aids decision-making based on past market data and charts, fundamental analysis investigates economic and fundamental factors to determine asset intrinsic values. A combined use of both methods can help traders make better decisions in financial markets and mitigate trading risks.


