The past of Ethereum says it all: Is ETH ready for a massive rally?
Ethereum is showing signs of a rebound, with technical patterns indicating a potential breakout.

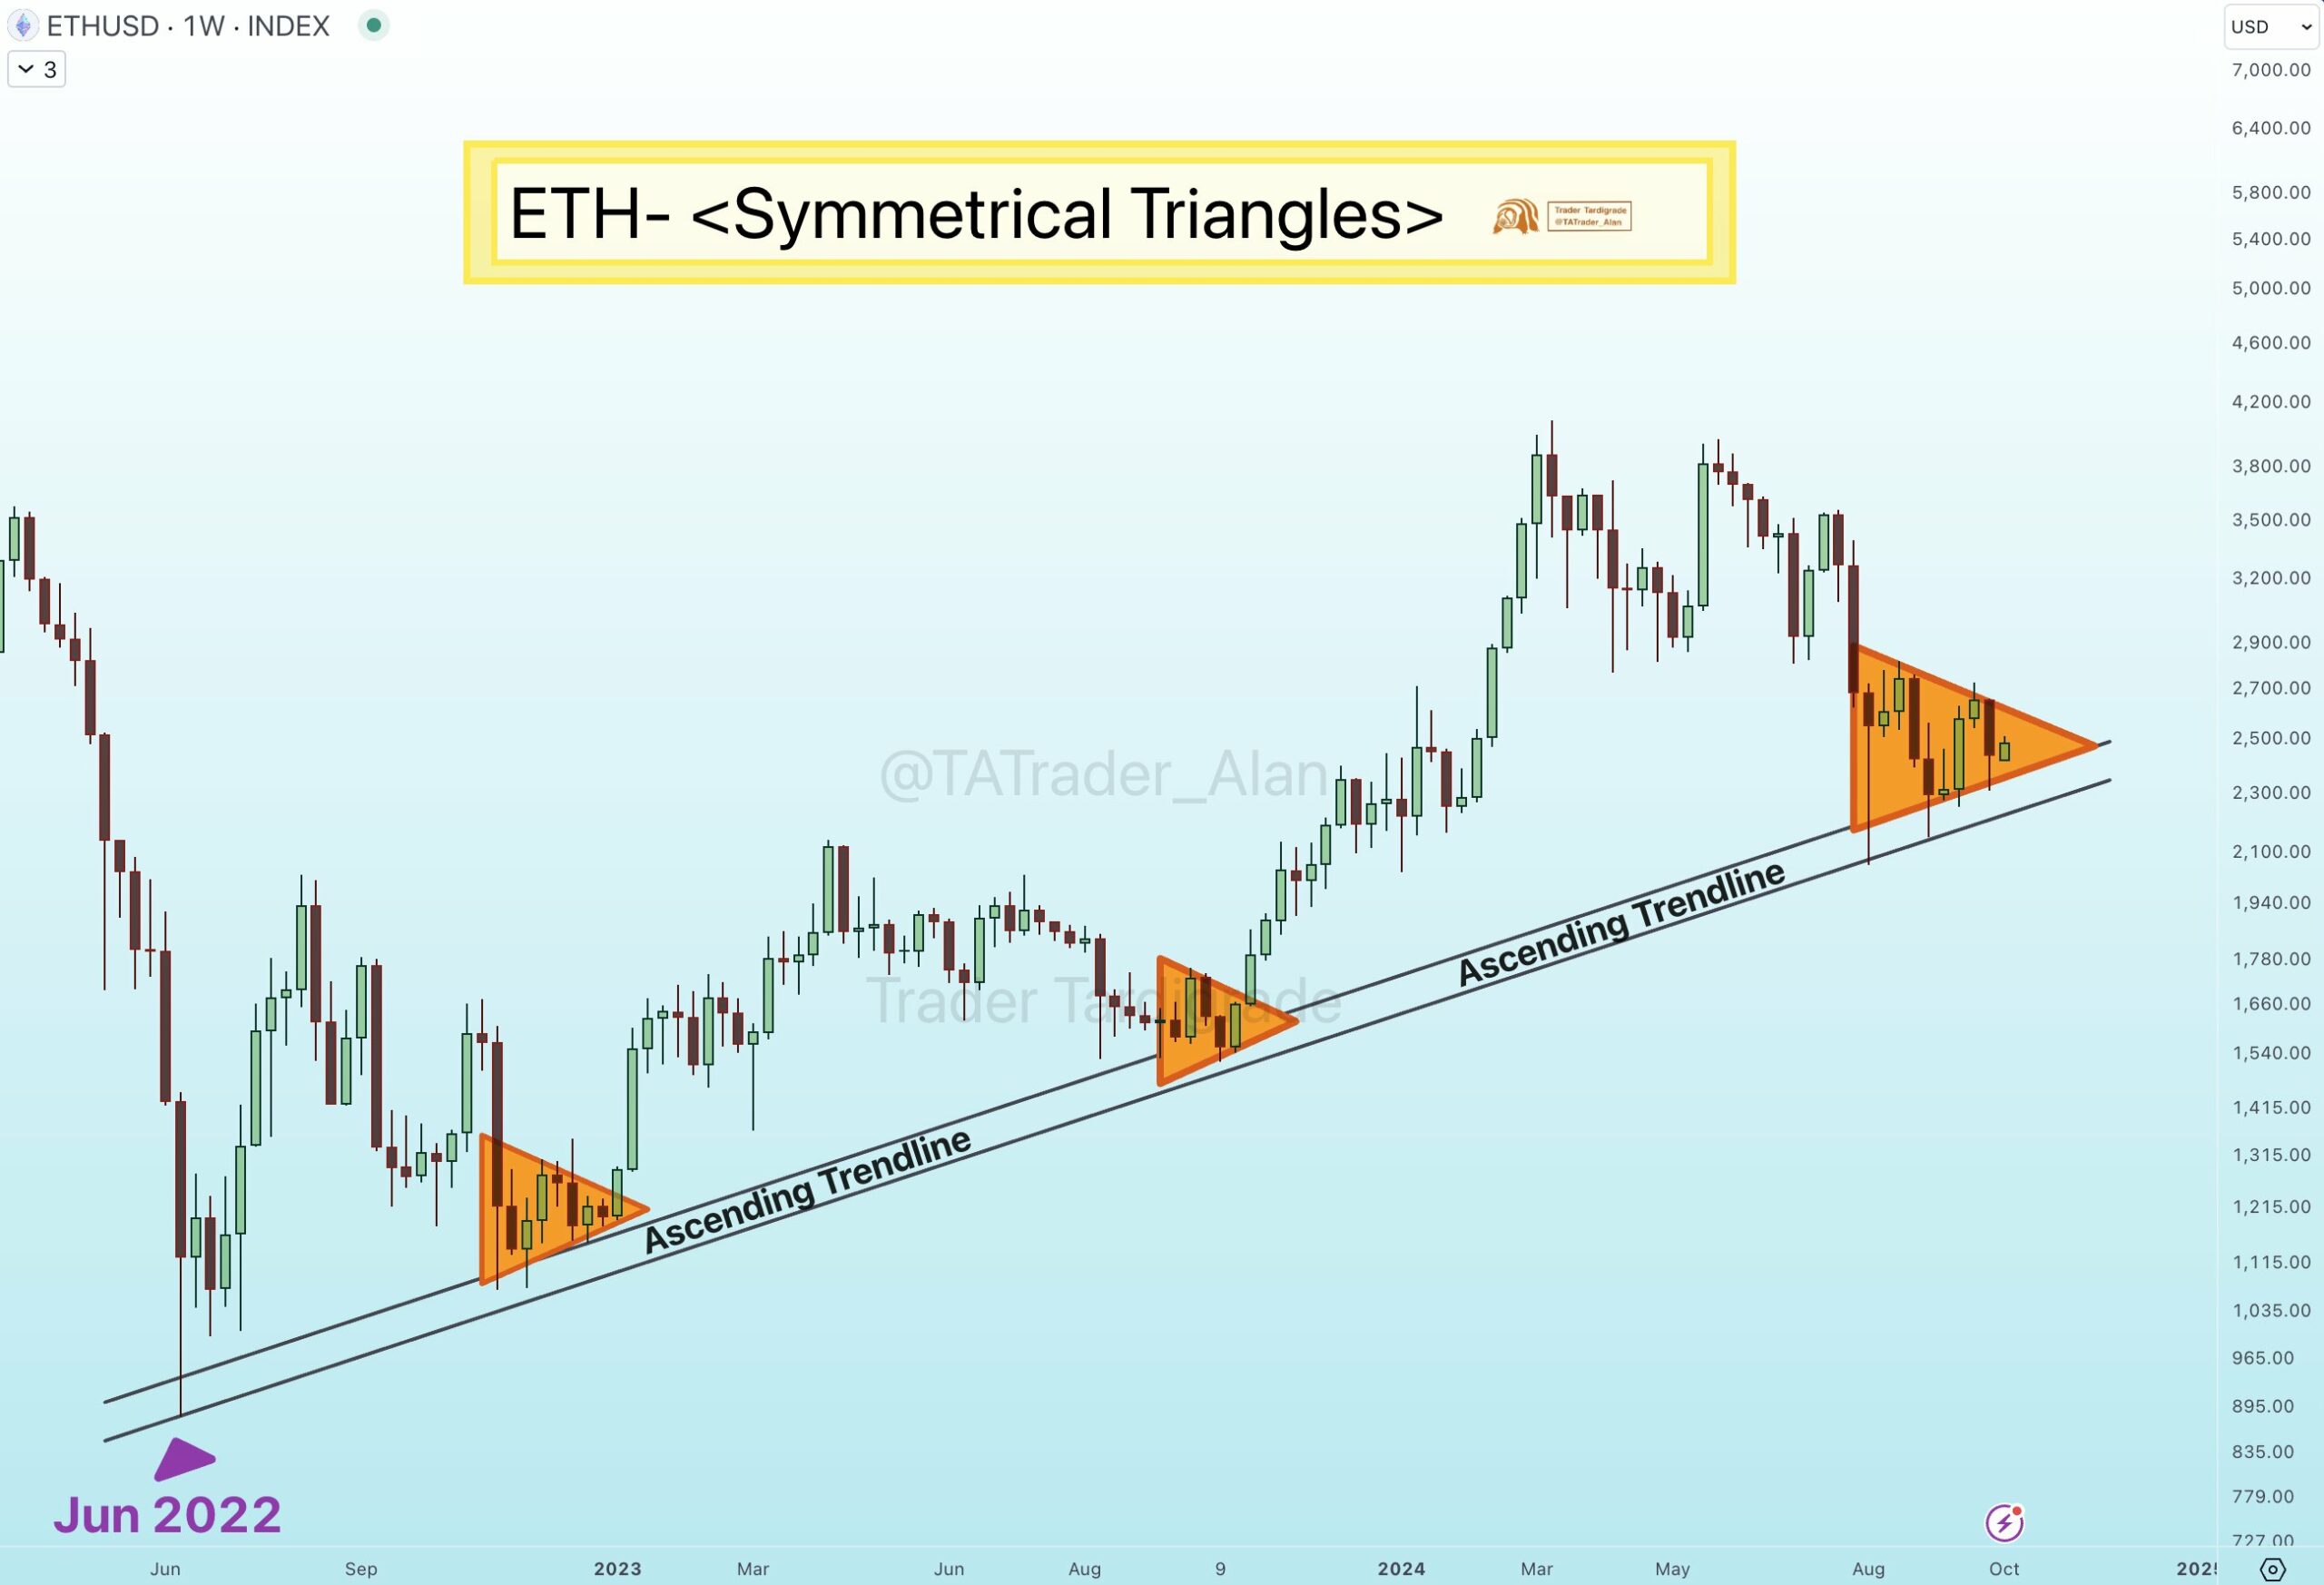
A symmetrical triangle and an upward trendline indicate a potential bullish reversal for Ethereum.
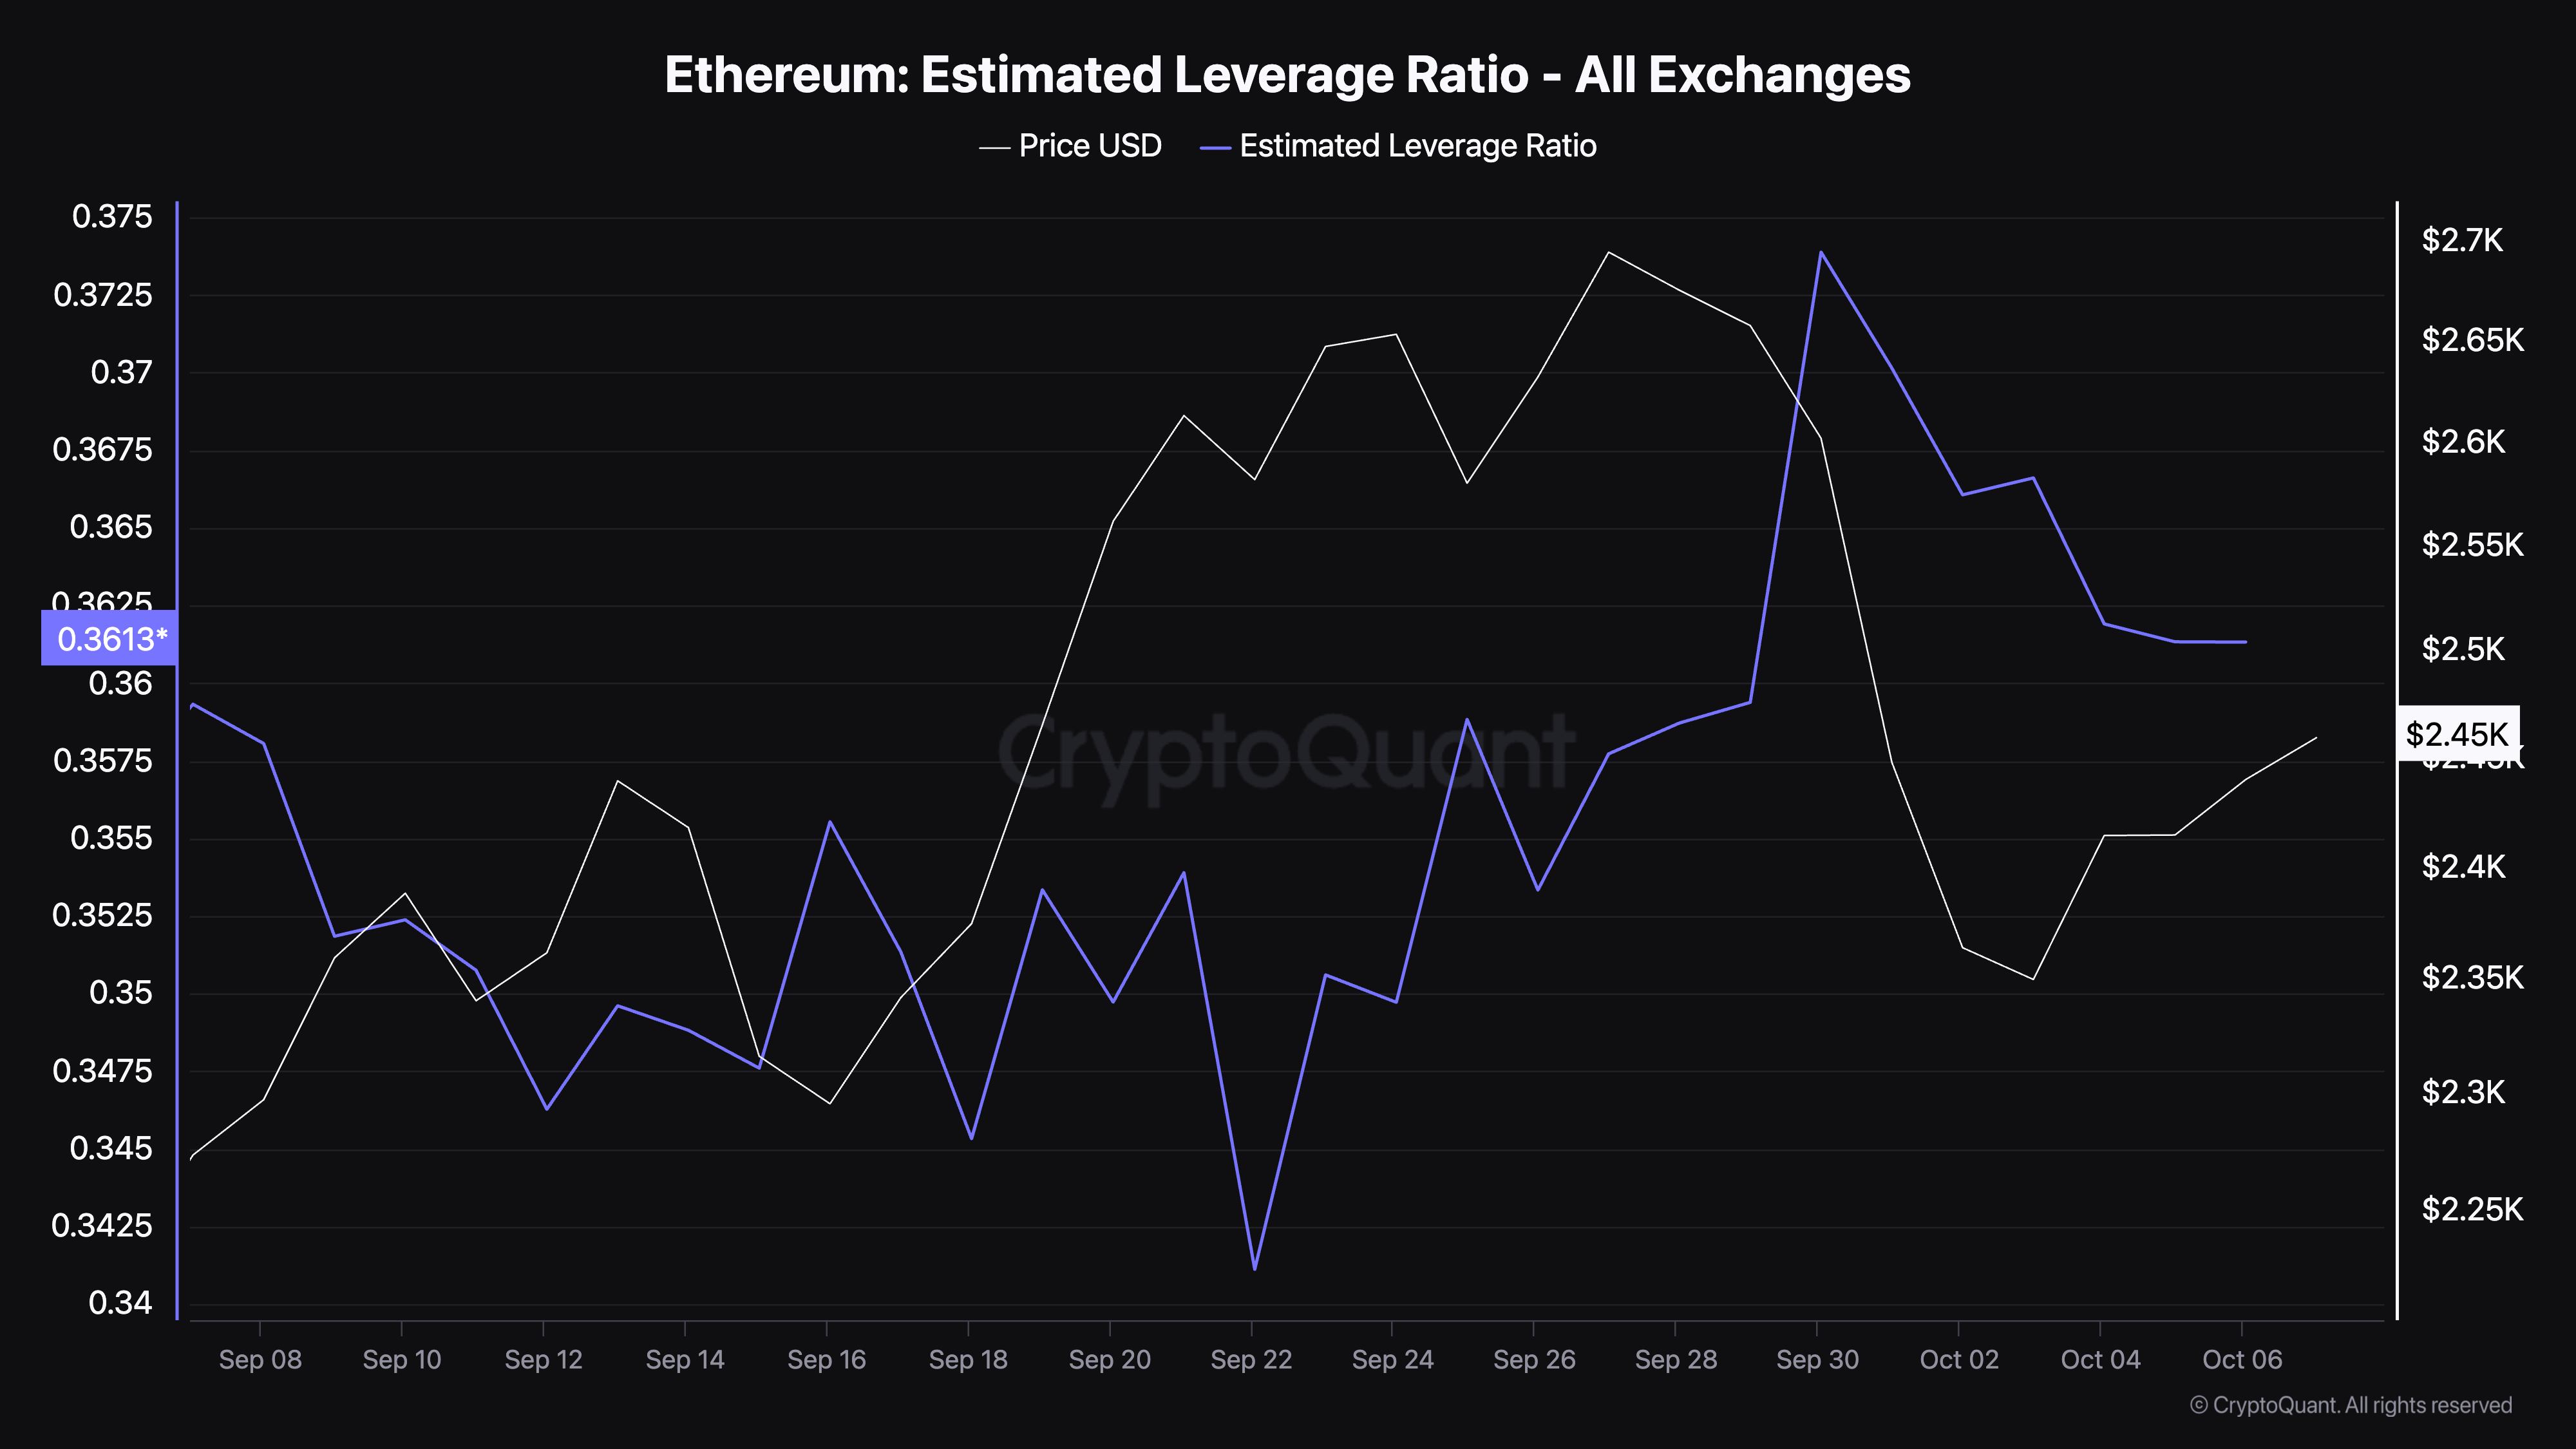
- The leverage ratio of Ethereum and open interest reflects key trends that may soon impact price movements.
Ethereum (ETH) has closely mirrored overall market dynamics and recently experienced a significant price jump. Following Bitcoin’s (BTC) movement, Ethereum gradually recovered after a week-long decline that saw the asset drop 7.2%, bringing its price below $2,400.
As of this writing, ETH has managed to reclaim some ground, trading at $2,451 with an average increase of 1.1% over the past 24 hours.
Amid this price recovery, a well-known cryptocurrency analyst, Trader Tardigrade, recently shared insights on Ethereum’s price chart. This analyst noted that ETH has been following an upward trendline since June 2022, showing a consistent pattern.
Is Ethereum Set to Rebound?
According to this analyst, each time Ethereum approaches this trendline, it forms what is known as a symmetrical triangle before making a bullish leap.
Current market activity indicates the formation of another symmetrical triangle just above this trendline, hinting at a potential imminent rebound for Ethereum. Tardigrade’s analysis suggests that ETH is approaching a crucial support zone, with this triangle formation potentially providing the momentum needed for a bullish breakout in the coming days.


